


Virtual Elevation Testing: Problems and Promise
Summary: The Virtual Elevation Method is based on physically sound concepts. In practice, however, tests using this method have produced unreliable results. Attempts at validating the method have failed to reproduce the claimed precision. A possible explanation: Testers ‘guess’ initial values for rolling resistance (Crr) and aero drag (CdA) as they match measured and predicted data, rather than fitting the curves blind. Since testers will start with what they consider ‘likely’ values for Crr and CdA, this may cause bias confirmation: It may automatically confirm the hypothesis, whether it is actually correct or not. Separating data collection from analysis and doing the analysis blind might help resolve these issues and make the method more reliable. In its current form, the Virtual Elevation Method cannot be trusted to produce reliable results.
If you’ve been following bike tech over the last decade or so, you’ve probably heard about the Virtual Elevation Method. This technique allows testing bike performance, especially aerodynamics, without needing a wind tunnel. More recently, it’s also been used to test the rolling resistance of tires. Over the years, we’ve had discussions on-and-off with the method’s creators and proponents, as well as with other researchers who’ve raised questions about its reliability. Recently, we’ve had the opportunity to take a closer look at its potential and pitfalls.
A little while ago, we wrote in a discussion of the new 32-inch wheels that “there is a total absence of data to back up claims of superior performance of larger wheels” (for road, all-road and gravel bikes). Not everybody agreed with this assessment. There is a lot of excitement in the industry right now about the new wheel size, and there’s a scramble to back this up with data. John Karrasch, who has been at the forefront of testing the new 32-inch tires, wrote: “The only problems with my data are that they don’t fit your mindset.” His results show the 32-inch tires rolling much, much faster. He’s been vocal about his disagreement with our findings, in private conversations and on social media.
In the bike industry, it’s common to ignore data that doesn’t fit one’s ideas. An example: We’ve known for 20 years that wide, supple tires roll as fast as narrow rubber. And yet the mainstream media pretended for many years that all the data supporting this simply didn’t exist… But that’s not how science works. If there is contradictory data, everybody works together to resolve the issues and figure out what is really going on. It’s not about being right or wrong: If 32-inch wheels roll faster, we all want to know. I certainly do. I’d love to have faster wheels for my next race or FKT attempt! And as a company, Rene Herse Cycles already offers our ultra-fast TPU tubes for 32″ wheels. It would be no problem to add supple 32″ tires to our program.
As a side note, John has also tested the rolling resistance of our Snoqualmie Pass tires, and found them to be among the faster tires he’s tested. The goal here is not to discredit results we don’t ‘like,’ but to evaluate a new testing method—and figure out how to make bicycles faster in the real world.
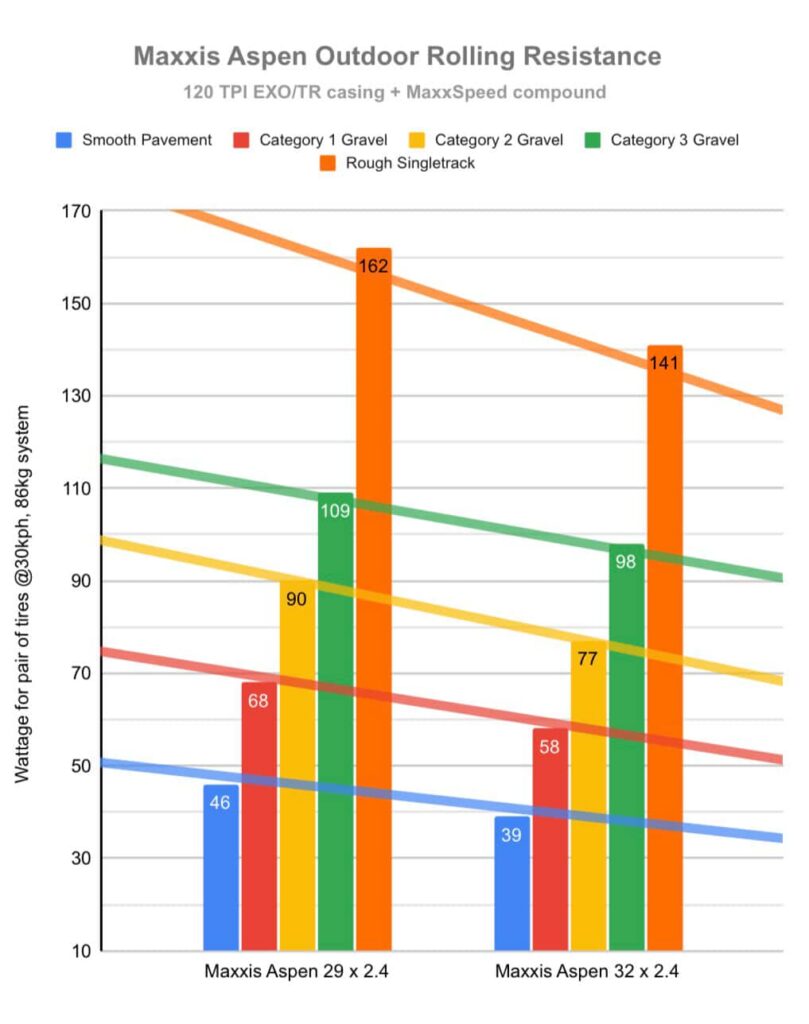
In response to our article about 32″ wheels, John Karrasch sent his latest data (above). John is a smart guy, and he’s conscientious with his testing. As mentioned above, the goal here is to figure out what’s really going on with 32″ tires. John pointed out that his data shows very significant performance benefits for 32″ wheels—on all surfaces. The graphs on the right (32″) show savings of between 21 and 10 watts over those on the left (29″).
Perhaps most striking is the extra speed on pavement (blue bars and line). The 32-inch tires to consume 15% less power on smooth pavement: 39 watts vs. 46 watts. (These are watts attributed to rolling resistance, not total watts required to power the bike.) John’s tests of other 32″ tires show similar savings on smooth pavement.
A savings of 15% is huge—especially since 32″ wheels are just 7.3% larger than 29″.
I mentioned to John that this represents an unexpectedly large performance benefit—coming from wheels that are just slightly larger. His reply: “No shit. And it’s across THREE DIFFERENT TIRE MODELS.”
It’s hard to think of a mechanism that reduces the rolling resistance of slightly larger wheels by this much on smooth pavement. Roll-over isn’t a factor on smooth surfaces. The contact patch shape isn’t all that different, considering that wheel sizes are just 7.3% different. When I asked about possible explanations for this surprising result, John replied: “I don’t know everything and don’t waste my time guessing.” He continued: “You gotta get past the percentage improvement on pavement. The pavement results are the least important thing.”
I understand John’s point: Everybody wants to know how much faster 32″ wheels are on rough surfaces: gravel, cobblestones, singletrack. Why should we focus on the smooth pavement data? The counterpoint: The smooth pavement data provides a useful test for the methodology. If the data for smooth pavement are incorrect, then it’s likely that the other results also have problems.
Perhaps these are two different schools of thought. One is best summed up with Carl Sagan’s mantra: “Extraordinary claims require extraordinary evidence.” The other might be paraphrased as: “Extraordinary findings are just extraordinary! No need to explain them.” Or as one article put it: “32-inch tires are way faster on most terrain—even where you wouldn’t expect it!”
Here at Rene Herse Cycles, we have made plenty of extraordinary claims ourselves. Back in 2006, the results of our first real-world tire performance study were unexpected: High pressure doesn’t make supple tires roll faster. Wide tires can roll as fast as narrow rubber. That was very controversial. It went against what everybody believed—us included. That’s why we left no stone unturned to confirm, replicate and validate our results.
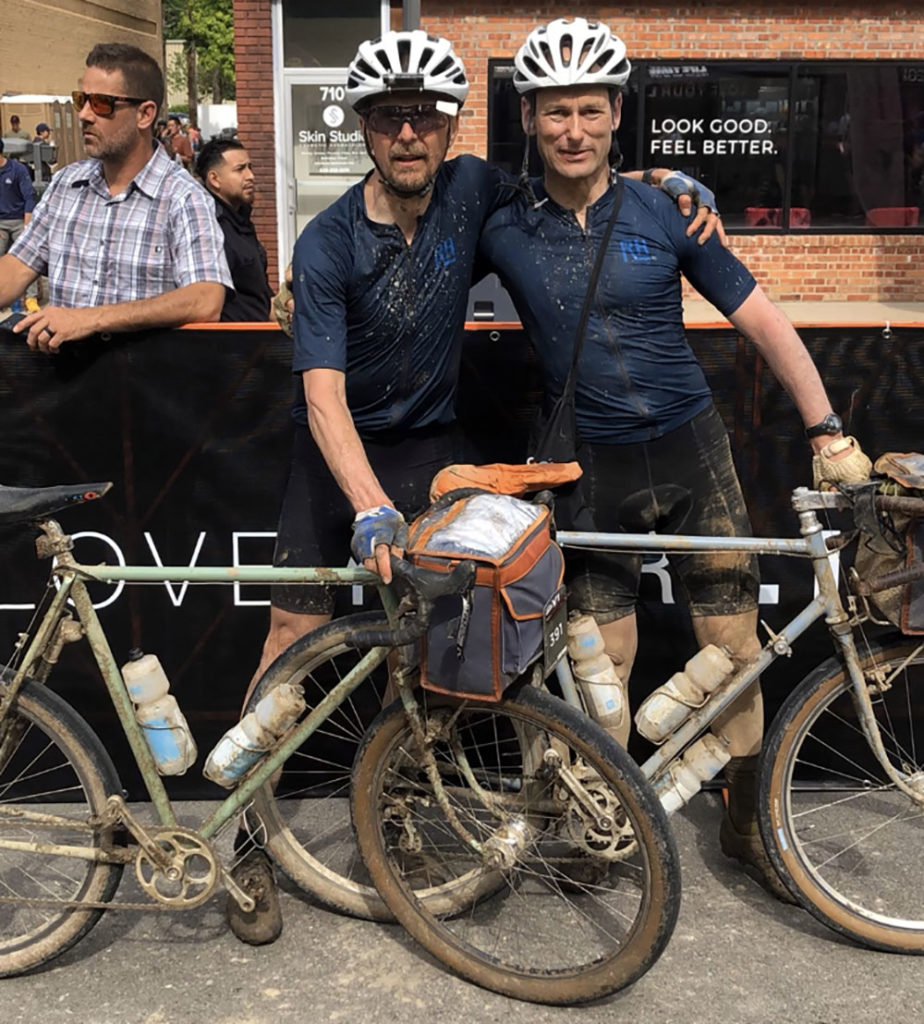
As scientists, that’s our speciality. My Ph.D. is in science. I spent half a decade learning how to design studies and also how to spot problems. My collaborator Mark VdK is even more of an expert in this field. He has a Ph.D. with a minor in applied mathematics, and he has worked for years as a senior research and data analyst at the world’s leading company for enterprise resource planning. Designing tests is his speciality. I only mention these credentials to head off criticism that we’re just a bunch of curmudgeons who don’t like change.
We’re serious about science because we’re serious about having fun on our bikes. Our bikes may not always look like those of mainstream racers, but they work extremely well. Often they are ahead of their time. Like when we raced Unbound XL in 2022 on 54 mm-wide tires. Back then, that was considered ‘too much tire’ even for the Flint Hills of Kansas. Today, tires that wide aren’t controversial any longer. We also ran narrow handlebars for better aerodynamics, way back when most gravel racers were on burly 44 cm bars. That’s another area where the mainstream has caught up with us.
If I may say so, we’ve got a good track record. The results of our testing have stood the test of time. It’s taken a while, but most of our initially ‘controversial’ results have been accepted by the mainstream.
That’s no coincidence—it’s the result of careful testing and relentlessly questioning our results. Here is what we did to make sure our findings about wide tires and low pressure were real:
- We looked for an explanation: Suspension losses caused by vibrations were the likely reason why high pressure didn’t make tires faster. Previous drum tests (without a rider) didn’t measure suspension losses, so they missed how vibrations slow down the bike. (Thanks to Jim Papadopoulos for digging up a 1960s Army research study that first discovered suspension losses.)
- We measured suspension losses in our famous rumble strip tests. This confirmed our hypothesis: Significant energy was lost to vibrations. That’s why wide, soft tires roll as fast as narrow, hard rubber—or faster, depending on how rough the surface is.
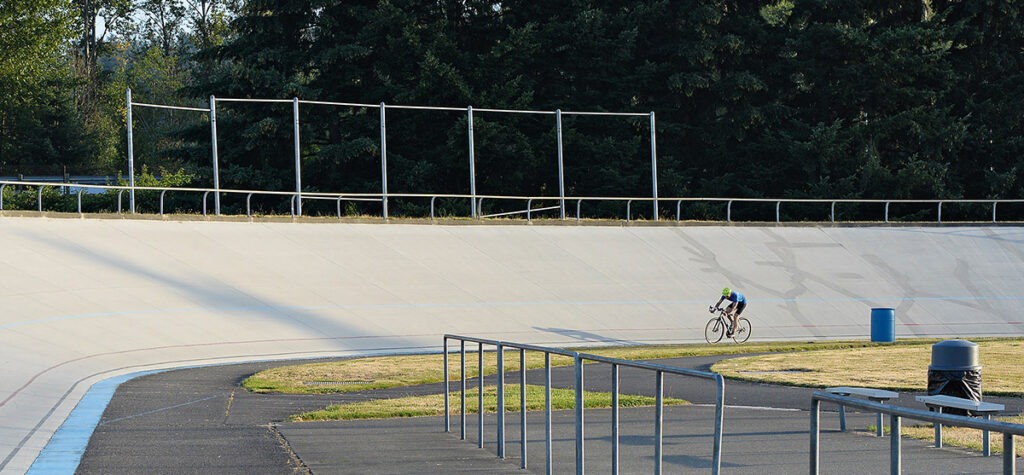
- We replicated our roll-down tests with a different methodology: We rode around a track with a precision power meter (above). The results were the same with both methods.
- In wind tunnel testing, we confirmed that our test riders are able to maintain the same position, time and again. That means we didn’t need to worry about changes in rider position adding noise to our measurements.
- We had our research peer-reviewed by cycling science experts before we published our findings.
- We started using wide tires to gain in-the-field experience: Our times in long-distance brevets and races improved on wide tires. Real-world practice matches the theory.
Since we first published our results 20 years ago, they’ve gone from controversial to widely accepted. Today, most mainstream makers and journalists agree with our findings. Pro racers have moved from 23 mm tires to 28 or 30 mm tires, even for smooth courses—and their speeds have gone up. Controlled studies by others, like the Escape Collective, have confirmed many of our findings. There’s really no longer any doubt. Wide tires are here to stay. And pressures of 100 psi (7 bar) and more are history. It’s no coincidence that Tadej Pogačar inflates his tires to the values recommended by the Rene Herse Tire Pressure Calculator. Those values are based on our research, and they really work on the road (and not just in the lab).
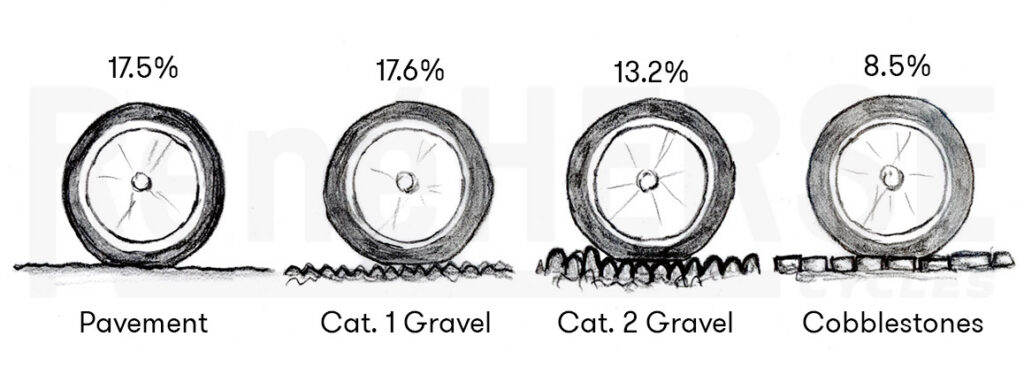
Back to 32″ wheels: John’s data shows a huge performance advantage for 32″ wheels on smooth pavement. No matter whether you believe that larger wheels have better ‘roll-over’ or not, you’d expect that advantage to be greatest on rough gravel and cobblestones. Instead, John’s data shows twice as much benefit of the larger wheels on smooth pavement than on the roughest surfaces he tested.
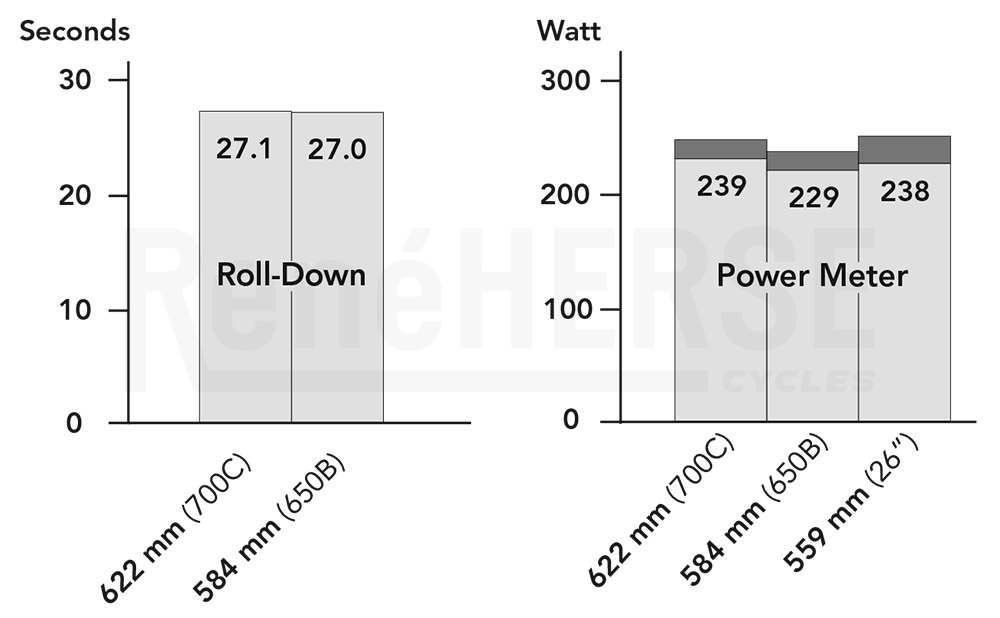
Here’s what our own tests show: On smooth pavement, there’s no performance benefits for bigger wheels. In the roll-down test (left), the smaller wheels rolled marginally faster, but the difference wasn’t statistically significant. With the rider pedaling (right), there’s a little more noise, but again large wheels do not require less power than the smaller ones. (The differences are once again not statistically significant.)
Large wheels offering no performance advantage is the opposite of what John’s data shows. To resolve this discrepancy, we need to look at the testing methodologies. Our data comes from both roll-down tests (left) and tests with power meters (right). Each time, we used the same tire model in different sizes. We tested on calm days, with constant temperatures, and we did a statistical analysis. Two different methods, two different tire models, same result: Wheel size doesn’t affect speed on smooth pavement.
And let’s not forget: These results are part of two decades of studying tire width and suspension losses. Our studies have been validated. They are now widely accepted. It’s fair to say that these studies are reliable. In other words: To challenge these results, simply presenting new data is not enough. You also need an explanation why the existing data is incorrect. Remember: All the other data from the same studies has been reliable—there’s no reason to doubt just this small part of our studies.
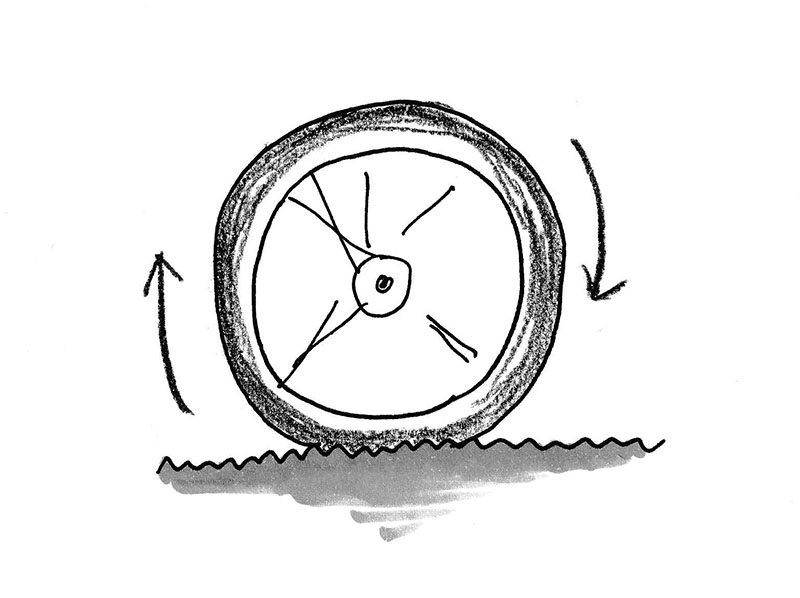
We don’t just have data, but also physics to explain these results: Pneumatic tires deform where they meet the road. The radius of the wheel doesn’t make a difference as long as surface irregularities are small enough to be absorbed by the tire. On smooth roads, that’s definitely the case.
Let’s look at John’s methodology, which shows 32″ wheels rolling so much faster on all surfaces, including smooth pavement? John has been testing tires using the Virtual Elevation Method. It’s a clever methodology, based on simple physics: Aerodynamic drag goes up exponentially with speed, while rolling resistance (and other mechanical resistances) go up linearly. What this means: At low speeds, a large portion of the rider’s power output goes toward rolling resistance. At high speeds, most of the rider’s watts push against wind resistance. If we measure power output at various speeds, we should be able to separate rolling resistance and wind resistance. To illustrate how this works, let’s look at two rider/bike scenarios:
- Bike/rider 1: fast-rolling tires, upright position. Rider 1 will require very little power at low speeds. At high speeds, their power output will increase exponentially.
- Bike/rider 2: slow tires, low aero position. Rider 2 will need more power at low speeds. To go faster, they’ll only need to increase power by a smaller percentage than Rider 1.
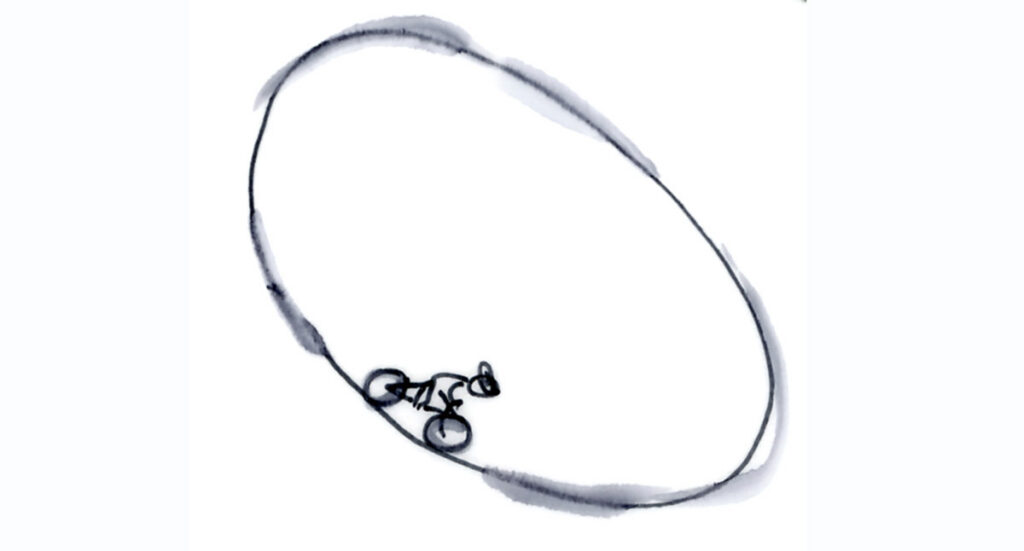
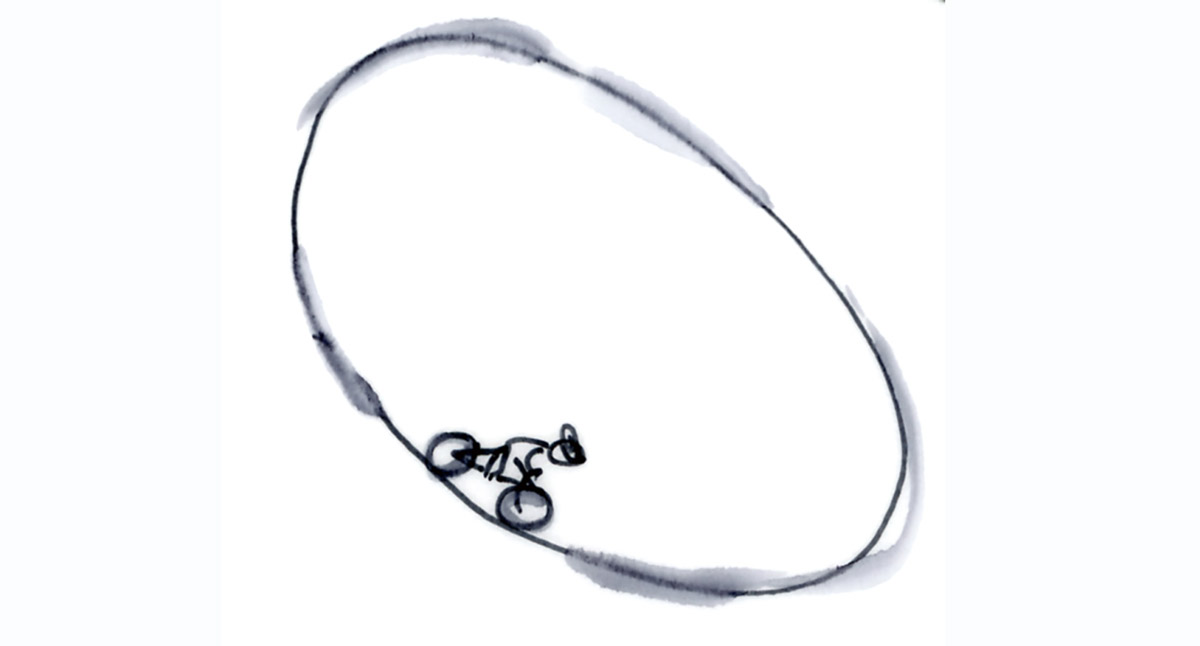
How does this test work in practice? For the Virtual Elevation Method, the bike is ridden on a circular course. The course should have some elevation gain, but coasting and braking should be avoided. The course is ridden at variable speeds. Power, speed and elevation are recorded. (John took the elevation profile off topography data, rather than relying on less-accurate GPS.) Estimates of wind resistance (CdA) and rolling resistance (Crr) are plugged into a spreadsheet until the ‘virtual elevation’ and actual elevation profiles match.
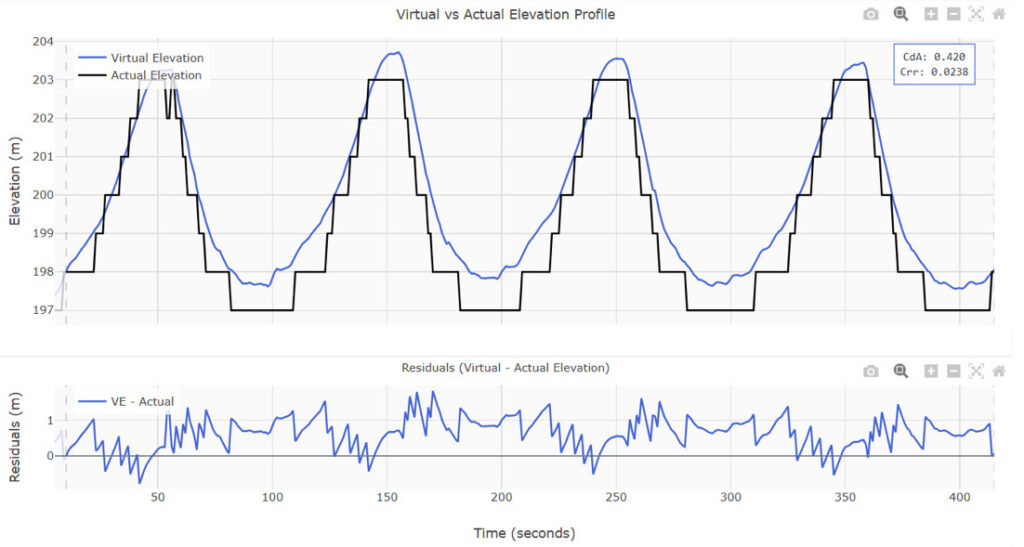
Above are the calculated elevation curve (blue) and the actual elevation of the course (black; the elevation data is in 1-meter steps). The accuracy is within ±1% (above). That’s incredible precision, considering this is real world testing on two bikes (carbon 29er, titanium 32″), at various power outputs.
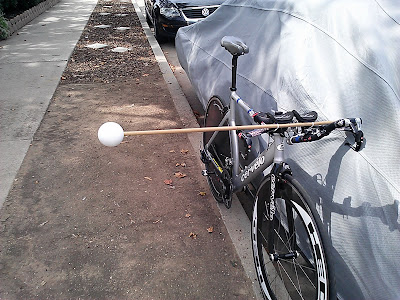
John’s testing is not the only case where the Virtual Elevation Method results in implausibly high precision. Consider Tom Anhalt’s test results: Tom suspended small spheres (foam balls) on a stick to place them in undisturbed air while he rode (above).
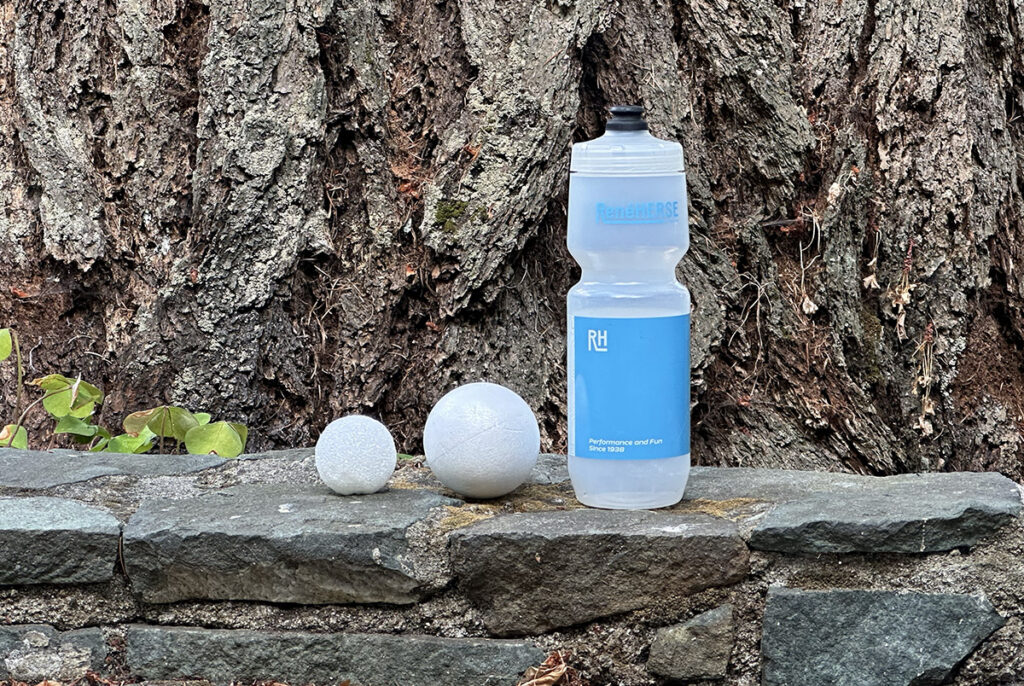
Tom tested four setups: no foam ball and three different foam balls that measured 2″, 3″ and 4″ in diameter (in metric, that’s 5 cm, 7.5 cm, 10 cm.) To visualize this, I bought the same size foam balls. In the photo above, you see the 2″ and 3″ balls compared to a standard water bottle. The differences are pretty small. It would be amazing if one could detect them with a rider on the bike whose pedaling motions introduce all kinds of ‘noise.’
Using the Virtual Elevation Method, Tom easily detected the changes in wind resistance, as he attached the different balls to his bike. According to his calculations, the 2″ ball increased the wind resistance of his bike/rider setup by 0.08%. Using the Virtual Elevation Method, Tom could detect that tiny difference (below). The larger balls increased drag by 0.6% and 1%, and he detected those, too.
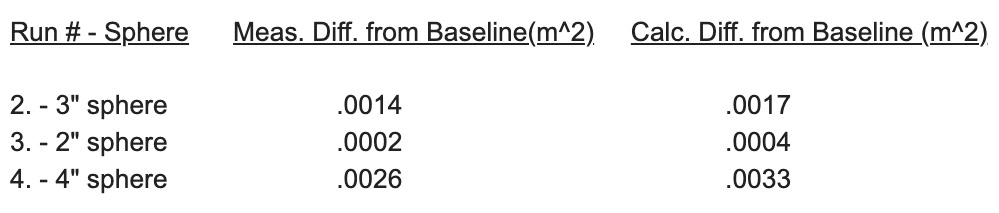
As with John’s data, we have no doubt that Tom is conscientious in reporting what he measured. If there is a problem, it’s with the methodology. What’s remarkable isn’t just the ability to detect tiny differences, but also that the data is so ‘clean.’ The measured differences (center column) track the calculated differences (right column) almost exactly. Anybody who has done real-world testing knows that some ‘noise’ in the data is unavoidable. There are always very slight wind currents—even on perfectly calm days. Even a good rider will change their position ever-so-slightly. Temperature is not 100% constant, especially on a road course. Other variables can affect the results, at least a little bit.
Can the Virtual Elevation Method really filter out all this noise and get incredibly ‘clean’ and precise data? To quote Carl Sagan again: “Extraordinary claims require extraordinary evidence.” Basically, the Virtual Elevation Method needs validation using a different methodology. Just like we validated our roll-down tests with power meter tests…
To validate the method, Dyer & Disley compared wind tunnel tests with results from the Virtual Elevation Method. For the Virtual Elevation Method, they tested on an indoor velodrome. With no wind, constant temperature and a very uniform surface, conditions were about as perfect as possible. They also knew the Coefficient of Rolling Resistance (Crr) from previous testing, so they only had to ‘guess’ the wind resistance (CdA) when they matched the curves.
They found a coefficient of variation of 0.7-0.9% in the wind tunnel, and 2-3% with the Virtual Elevation Method. They tested two different shapes of prostheses for amputee cyclists. One was round, the other streamlined. They could detect a statistically significant difference in the wind tunnel, but not using the Virtual Elevation Method.
What this means: Even under perfect conditions and with Crr already known, Dyer & Disley were unable to get anywhere close to the precision that John and Tom found in their testing with the Virtual Elevation Method. Even in the controlled setting of the wind tunnel, where the rider pedals at constant power and cadence, small changes in rider position are inevitable. The result is ‘noise’ that makes it impossible to detect very small changes like those balls that Tom attached to his bike. It’s also important to remember: The Virtual Elevation Method can separate rolling and wind resistance, but there is no mechanism to separate rider-induced changes in wind resistance from those caused by changes to the bike. There’s no way to tell whether the rider has lifted their head slightly, or whether there’s a slightly larger ball attached to the bike.
Why are Tom and John getting so much better results in outdoor testing than Dyer & Disley in their carefully controlled indoor testing? And why, on the other hand, does the Virtual Elevation Method sometimes produce strange results—such as 32″ wheels offering such a large advantage on pavement than on rough gravel or cobblestones (above)? You would expect the opposite: Large wheels should offer the greatest advantage on the roughest surfaces. In other words, why is the Virtual Elevation Method sometimes so incredibly precise, but in the same test sessions also provides results that clearly don’t make sense?
Mark VdK—who develops testing methods for a living—identified a potential problem when fitting the actual and virtual elevation curves to each other. The tester guesses aero drag (CdA) and rolling resistance (Crr), and then checks whether the curves work with those guesses—until the curves match. The fitting of the data to the curves is not done blind, but based on the tester’s hypothesis. If the tester thinks that 32″ wheels roll faster, they’ll start their ‘curve fitting’ by plugging in lower rolling resistance (Crr) for the bigger wheels. Since the tester ‘guesses’ two variables, multiple curves will fit the data. The tester starts with ‘reasonable’ guesses for Crr and CdA—which means the self-selected curve tends to be the one that confirms the hypothesis. That may be the reason the data looks so consistent—more consistent than any direct real-world measurements.
In other words, the Virtual Elevation Method may inadvertently create a form of circular reasoning: When testing balls attached to your bike, it’s natural to ‘guess’ that the wind resistance increases slightly each time you make the ball bigger. You’ll start with a curve that confirms the hypothesis, and it will match your data with a little tweaking—which then seems to confirm that the method is working. It’s the same when testing 32-inch wheels. If the tester starts their ‘guesses’ with a lower rolling resistance for the larger wheels, they’ll probably find a curve that fits—which is what they expected in the first place. It would be the same if you tested different tires: The tires that you ‘guess’ are fast will—most likely—turn out to be fast in your testing.
In science, this is called ‘bias confirmation,’ and it’s considered a huge problem—exactly because the results match what everybody expects. (Who is going to question something that seems to make sense, like larger wheels rolling faster?) In fact, much of the scientific method is designed to avoid this.
Often, the bias becomes obvious when we look at results that were not part of the original hypothesis—like the behavior of the 32″ wheels on smooth pavement in John’s testing. In John’s own words, he wasn’t too concerned about the results on smooth pavement. If the testing method was reliable, you’d expect the results to make sense nonetheless. However, they don’t make sense—which strongly suggests that there’s a problem with the methodology. And that problem extends to all results, not just those that don’t make sense.

One way to improve the Virtual Elevation Method would be to make it blind. Double-blind testing is the gold standard for medical studies: Neither patient nor test administrator know whether the patient is taking the medication that’s being tested or a placebo. If you suggested doing medical research that isn’t blind, you’d be laughed out of the room.
When we tested the influence of frame stiffness on performance, we did a double-blind test (above): Only the framebuilder, Jeff Lyon, knew the differences in frame tubing between the test bikes. The bikes were built up with identical components. Their weights were equalized. For each test session, the test administrator marked the bikes with red, green and pink stem caps, but even the administrator only knew the bikes as #1, #2 and #3—and not their actual specs.
The riders only saw the colors of the stem caps—and those were switched from one test session to the next. In other words, riders had no idea which bike they were riding—not even whether it was the same bike they’d ridden during the previous test session or a different one.
Riders were not allowed to talk about the bikes or compare notes. (That’s why they sit so far apart in the photo above.) Once the testing was complete and the notes were finalized, the test was ‘unblinded’: Now the framebuilder shared which bike was made from which tubing. And the administrator shared which bike had which color stem cap during each test session. Only now did the testers find out which bikes they had been riding in each test session, but they no longer could change what they wrote about them. As a result, their impressions of each bike were free of bias. And the power measurements also weren’t influenced by riders thinking that one bike might be faster than the other. (The riders were not able to see the power numbers during the tests.)
Double-blind testing is not possible with bikes of different wheel sizes, but the testing should at least be blind: Have one tester collect the data, and another do the analysis. Will the results be the same without knowing which dataset is from 32″ wheels and which is from 29″ wheels? Rather than guessing ‘likely’ values for rolling resistance (Crr) and aerodynamic drag (CdA), the data analysis would test a wide range of values and determine which offers the best fit. This blind curve matching would eliminate the problem of starting with values that match the hypothesis.
What would happen if the curve fitting was done blind? My prediction is that the erroneous results—such as the huge benefit of 32″ wheels on smooth pavement—would disappear. However, at the same time, more ‘noise’ would be introduced. Dyer & Disley’s study suggests that the real-world precision of the Virtual Elevation Method, under ideal conditions, is about 2-3%—not even close to the 0.1-1% reported by John and Tom Anhalt. Once you test outside, rather than in an indoor velodrome, there will be even more noise.
None of this is intended as criticism of John or Tom’s work. Both are very conscientious in their testing—it’s the methodology that appears to have problems. As I mentioned in the beginning, the goal is not to prove who is right or wrong, but to figure out how bicycles really work. Despite the obvious issues with the Virtual Elevation Method—both the ‘incredible’ precision and the erroneous results—the underlying physics are sound. The method holds promise. The question is this: Once the method is improved with blind fitting of the curves, will we still get useful results? Or will there be too much noise? There is only one way to find out: Do the experiment described above, or validate the method in some other way. Until then, data collected using the Virtual Elevation Method should not be used as evidence that one setup performs better than another.
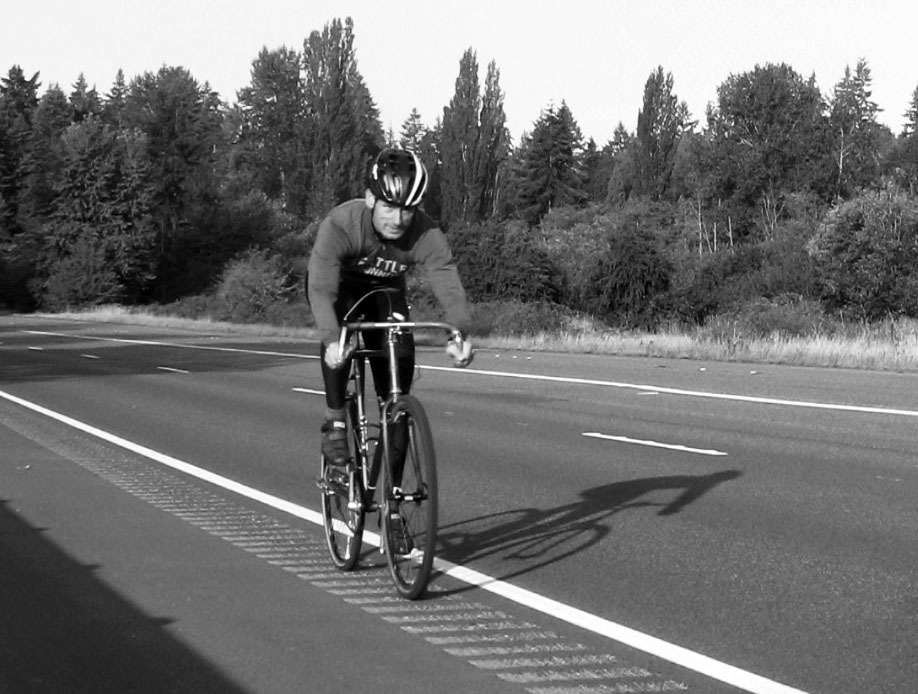
As to 32″ wheels, hopefully somebody will soon do a carefully controlled test with direct measurements, like our rumble strip tests (above) or the Escape Collective’s tire tests. If those tests show a big advantage for 32″ wheels, we’ll have moved one step further.
However, even that will not be enough: We’ll still need to find out why there’s no significant performance difference between 26″, 650B and 700C/29″ wheels in Bicycle Quarterly’s testing, and why the next step up to 32″ wheels suddenly reduces rolling resistance by a large margin. Because simply ignoring previous research is not how science works, especially if that previous research has been validated many times.
That validation is missing from the Virtual Elevation Method. As mentioned above, we’re offering to help with this validation, because a new method for testing bicycles under real-world conditions benefits everybody.
Further Reading:
- The Science: Why 32″ Wheels are not faster
- The original study of wheel size and performance was published in Bicycle Quarterly 35
- Dyer & Disley’s comparison of wind tunnel and Virtual Elevation data
- Virtual Elevation Test of 32″ wheels
- Virtual Elevation Test with small foam balls
- Our book The All-Road Bike Revolution goes deep into the science of why wide tires roll fast—and other research that’s revolutionized bicycles